Grade 7 Mathematics Course Details
Building unique learning experiences with the courses mapped to the national standards.
 Diagnostic Test
Evaluate your kid’s strengths,
proficiency level and gaps for FREE!
Course Metrics
-
 Skills
160
Skills
160 -
 Tutorials
130
Tutorials
130 -
Video Lessons
90
-
 Examples
364
Examples
364 -
 Free Response Questions
5200
Free Response Questions
5200 -
 Multiple Choice Questions
957
Multiple Choice Questions
957 -
 Online Practice Assessments
36
Online Practice Assessments
36 -
Offline Practice Sheets (print)
94
-
 Graded Assessments
38
Graded Assessments
38
Overview
The Grade 7 Math curriculum at Educo Learning Center (ELC) covers essential topics aligned with Common Core standards. In Grade 7, students will learn proportional relationships and how to apply them, working with rational numbers, working with expressions and linear equations, solving problems involving scale drawings and informal geometric constructions, and using two-dimensional and three-dimensional shapes to solve problems involving area, surface area, and volume. Students will also draw inferences about populations based on samples.
The Educo Learning Center Grade 7 Math program features visual simulations and stepwise practice worksheets to help students understand concepts, recognize mistakes, and develop problem-solving strategies. It also provides interactive math questions to track learning progress for teachers and parents.
"I Can" Statements For Math Grade 7
| Standard | 7.RP.A.1 |
|---|---|
| Standard Description | 1. Compute unit rates associated with ratios of fractions, including ratios of lengths, areas, and other quantities measured in like or different units. For example, if a person walks 1/2 mile in each 1/4 hour, compute the unit rate as the complex fraction 1/2/1/4 miles per hour, equivalently 2 miles per hour. |
| Online Corse Hierarchy | 2.1 |
| I Can Statements | I can calculate the unit rate for real-life situations by breaking down the ratio (fractions) and dividing to solve the problem to find the relationship between two units. |
| Standard | 7.RP.A.2 |
|---|---|
| Standard Description | 2. Recognize and represent proportional relationships between quantities. a. Decide whether two quantities are in a proportional relationship, e.g., by testing for equivalent ratios in a table or graphing on a coordinate plane and observing whether the graph is a straight line through the origin. b. Identify the constant of proportionality (unit rate) in tables, graphs, equations, diagrams, and verbal descriptions of proportional relationships. c. Represent proportional relationships by equations. For example, suppose total cost t is proportional to the number n of items purchased at a constant price p. In that case, the relationship between the total cost and the number of items can be expressed as t = pn. d. Explain what a point (x, y) on the graph e. of a proportional relationship means in terms of the situation, with special attention to the points (0, 0) and (1, r) where r is the unit rate. |
| Online Corse Hierarchy | 2.2 |
| I Can Statements | I can recognize and represent a proportion as a statement of equality between two ratios. I can analyze two ratios to determine if they are proportional with various strategies (ex: using tables, graphs, or pictures). I can define the constant of proportionality as a unit rate. I can analyze tables, graphs, equations, diagrams, and verbal descriptions to identify unit rates. I can represent proportional relationships by writing equations. I can explain what the points on a proportional relationship graph mean in terms of a specific situation and recognize what (0,0) and (1, r) on a graph represents, where r is the unit rate. |
| Standard | 7.RP.A.3 |
|---|---|
| Standard Description | 3. Use proportional relationships to solve multistep ratio and percent problems. Examples: simple interest, tax, markups and markdowns, gratuities and commissions, fees, percent increase and decrease, and percent error. |
| Online Corse Hierarchy | 2.3 and 2.4 |
| I Can Statements | I can apply proportional reasoning to solve multi-step ratio and percent problems (ex: simple interest, tax, markups, markdowns, gratuities, commissions, fees, percent increase and decrease, or percent errors). |
| Standard | 7.NS.A.1 |
|---|---|
| Standard Description | 1. Apply and extend previous understandings of addition and subtraction to add and subtract rational numbers; represent addition and subtraction on a horizontal or vertical number line diagram. a. Describe situations in which opposite quantities combine to make 0. For example, a hydrogen atom has 0 charge because its two constituents are oppositely charged b. Understand p + q as the number located a distance |q| from p, in the positive or negative direction, depending on whether q is positive or negative. Show that a number and its opposite have a sum of 0 (are additive inverses). Interpret sums of rational numbers by describing real-world contexts. c. Understand subtraction of rational numbers as adding the additive inverse, d. p – q = p + (–q). Show that the distance between two rational numbers on the number line is the absolute value of their difference, and apply this principle in e. real-world contexts. f. Apply properties of operations as strategies to add and subtract rational numbers. |
| Online Corse Hierarchy | 1.1-1.3 |
| I Can Statements | I can apply what I have learned about addition and subtraction to rational numbers. I can show addition and subtraction on a horizontal or vertical number line diagram. I can describe situations where opposite quantities combine to make 0. I can demonstrate and explain how when adding two numbers p + q: if q is positive, the sum of p and q will be |q| spaces to the right of p on a number line; and if q is negative, the sum of p and q will be |q| spaces to the right of p on a number line. I can explain and justify why the sum of p + q has located a distance of |q| in the positive or negative direction from p on a number line. I can represent how the distance between two rational numbers on a number line is the absolute value of their difference and apply this to real-world situations. I can identify the subtraction of rational numbers by adding the additive inverse property to subtract rational numbers, p – q = p + (-q). I can use properties of operations as strategies to add and subtract rational numbers. |
| Standard | 7.NS.A.2 |
|---|---|
| Standard Description | 2. Apply and extend previous understandings of multiplication, division, and fractions to multiply and divide rational numbers. a. Understand that multiplication is extended from fractions to rational numbers by requiring that operations continue to satisfy the properties of operations, particularly the distributive property, leading to products such as b. (–1)(–1) = 1 and the rules for multiplying signed numbers. Interpret products of rational numbers by describing real-world contexts. c. Understand that integers can be divided, provided that the divisor is not zero and every quotient of integers (with a d. non-zero divisor) is a rational number. e. If p and q are integers, then –(p/q) = f. (–p)/q = p/(–q). Interpret quotients of rational numbers by describing real-world contexts. g. Apply properties of operations as strategies to multiply and divide rational numbers. h. Convert a rational number to a decimal using long division; know that the decimal form of a rational number terminates in 0s or eventually repeats. |
| Online Corse Hierarchy | 1.4-1.7 |
| I Can Statements | I can apply what I have learned about multiplication and division of fractions to multiply and divide rational numbers. I can recognize and describe the rules when multiplying signed numbers and apply the order of operations, particularly the distributive property, to multiply rational numbers (ex: (-1)(-1) = 1). I can use the products of rational numbers to describe real-world situations. I can explain why integers can be divided except when the divisor is 0 and describe why a quotient is always a rational number. I can understand and describe the rules when dividing signed numbers and integers and recognize that -(p/q) = (-p)/q = p/(-q). I can use the quotient of rational numbers to describe real-world situations. I can identify how properties of operations can be used to multiply and divide rational numbers. (ex: distributive property, multiplicative inverse property, multiplicative identity, commutative property for multiplication, and associative property for multiplication.) I can change a rational number to a decimal using long division and explain how the decimal form of a rational number stops in zeroes or repeats. |
| Standard | 7.NS.A.3 |
|---|---|
| Standard Description | 3. Solve real-world and mathematical problems involving the four operations with rational numbers. |
| Online Corse Hierarchy | 1.1-1.7 |
| I Can Statements | I can solve real-world problems by adding, subtracting, multiplying, and dividing rational numbers, including complex fractions. |
| Standard | 7.EE.A.1 |
|---|---|
| Standard Description | 1. Apply properties of operations as strategies to add, subtract, factor, and expand linear expressions with rational coefficients. |
| Online Corse Hierarchy | 3.1 |
| I Can Statements | I can apply properties of operations to add, subtract, factor, and expand linear expressions with rational coefficients. Using the distributive property, I can combine like terms to factor and expand linear expressions with rational coefficients. |
| Standard | 7.EE.A.2 |
|---|---|
| Standard Description | 2. Understand that rewriting an expression in different forms in a problem context can shed light on the problem and how the quantities in it are related. For example, a + 0.05a = 1.05a means that “increase by 5%” is the same as “multiply by 1.05.” |
| Online Corse Hierarchy | 3.1 |
| I Can Statements | I can use properties of operations to write equivalent expressions. I can rewrite an expression in a different form if needed. |
| Standard | 7.EE.B.3 |
|---|---|
| Standard Description | 3. Use tools strategically to solve multi-step reallife and mathematical problems posed with positive and negative rational numbers in any form (whole numbers, fractions, and decimals). Apply properties of operations to calculate with numbers in any form, convert between forms as appropriate, and assess the reasonableness of answers using mental computation and estimation strategies. For example: If a woman making $25 an hour gets a 10% raise, she will make an additional 1/10 of her salary an hour, or $2.50, for a new salary of $27.50. If you want to place a towel bar 9 3/4 inches long in the center of a door that is 27 1/2 inches wide, you will need to place the bar about 9 inches from each edge; this estimate can be used as a check on the exact computation. |
| Online Corse Hierarchy | 3.2 |
| I Can Statements | I can solve multi-step real-world and mathematical problems using positive and negative rational numbers in any form (whole numbers, fractions, and decimals). I can determine if an answer makes sense using mental computation and estimation strategies. |
| Standard | 7.EE.B.4 |
|---|---|
| Standard Description | 4. Use variables to represent quantities in a real-world or mathematical problem, and construct simple equations and inequalities to solve problems by reasoning about the quantities. |
| I Can Statements | I can use variables to represent numbers in real-world or mathematical problems and make reasonable simple equations and inequalities to solve problems. |
| Standard | 7.EE.B.4a |
|---|---|
| Standard Description | a. Solve word problems leading to equations of the form px + q = r and p(x + q) = r, where p, q, and r are specific rational numbers. Solve equations of these forms fluently. Compare an algebraic solution to an arithmetic solution, identifying the sequence of the operations used in each approach. For example, the perimeter of a rectangle is 54 cm. Its length is 6 cm. What is its width? |
| Online Corse Hierarchy | 3.2 |
| I Can Statements | I can identify and fluently solve equations in the form px + q = r and p(x + q) = r. I can compare an arithmetic solution to an algebraic solution. |
| Standard | 7.EE.B.4b |
|---|---|
| Standard Description | b. Solve word problems leading to inequalities of the form px + q > r or px + q < r, where c. p, q, and r are specific rational numbers. Graph the solution set of the inequality and interpret it in the problem context. For example, you are paid $50 per week plus $3 per sale as a salesperson. This week you want your pay to be at least $100. Write an inequality for the number of sales you need to make, and describe the solutions. |
| Online Corse Hierarchy | 3.3 |
| I Can Statements | I can write and solve word problems leading to inequalities in the form px + q > r or px + q < r. I can graph and explain the solution to an inequality. |
| Standard | 7.G.A.1 |
|---|---|
| Standard Description | 1. Solve problems involving scale drawings of geometric figures, including computing actual lengths and areas from a scale drawing and reproducing a scale drawing at a different scale. |
| Online Corse Hierarchy | 4.1 |
| I Can Statements |
I can solve problems with scale drawings of geometric figures. I can figure out actual lengths and areas from a scale drawing and use them to create a different-sized scaled drawing. |
| Standard | 7.G.A.2 |
|---|---|
| Standard Description | 2. Draw (freehand, ruler, protractor, and with technology) geometric shapes with given conditions. Focus on constructing triangles from three measures of angles or sides, noticing when the conditions determine a unique triangle, more than one triangle, or no triangle. |
| Online Corse Hierarchy | 4.2 |
| I Can Statements | I can construct triangles and quadrilaterals with given conditions. |
| Standard | 7.G.B.4 |
|---|---|
| Standard Description | 4. Know the formulas for the area and circumference of a circle and use them to solve problems; give an informal derivation of the relationship between the circumference and area of a circle. |
| Online Corse Hierarchy | 4.3 |
| I Can Statements |
I can state the formulas for the area and circumference of a circle and use them to solve problems. I can explain the relationship between the circumference and the area of a circle. |
| Standard | 7.G.B.5 |
|---|---|
| Standard Description | 5. Use facts about supplementary, complementary, vertical, and adjacent angles in a multi-step problem to write and solve simple equations for an unknown angle in a figure. |
| Online Corse Hierarchy | 4.4 |
| I Can Statements | I can use properties of supplementary, complementary, vertical, and adjacent angles in multi-step problems to write and solve simple equations for an unknown angle in a figure. |
| Standard | 7.G.B.6 |
|---|---|
| Standard Description | 6. Solve real-world and mathematical problems involving area, volume, and surface area of two- and three-dimensional objects composed of triangles, quadrilaterals, polygons, cubes, and right prisms. |
| Online Corse Hierarchy | 4.5 and 4.6 |
| I Can Statements |
I can solve problems involving the area of triangles and parallelograms, the volume and surface area of cubes and right prisms. |
| Standard | 7.SP.A.1 |
|---|---|
| Standard Description | 1. Understand that statistics can be used to gain information about a population by examining a sample of the population; generalizations about a population from a sample are valid only if the sample is representative of that population. Understand that random sampling tends to produce representative samples and support valid inferences. |
| Online Corse Hierarchy | 5.1 |
| I Can Statements | I can understand that inferences about a population can be made by examining a sample. |
| Standard | 7.SP.A.2 |
|---|---|
| Standard Description | 2. Use data from a random sample to draw inferences about a population with an unknown characteristic of interest. Generate multiple samples (or simulated samples) of the same size to gauge the variation in estimates or predictions. For example, estimate the mean word length in a book by randomly sampling words from the book; predict the winner of a school election based on randomly sampled survey data. Gauge how far off the estimate or prediction might be. |
| Online Corse Hierarchy | 5.1 |
| I Can Statements | I can estimate population size using proportions. |
| Standard | 7.SP.B.3 |
|---|---|
| Standard Description | 3. Informally assess the degree of visual overlap of two numerical data distributions with similar variabilities, measuring the difference between the centers by expressing it as a multiple of a measure of variability. For example, the mean height of players on the basketball team is 10 cm greater than the mean height of players on the soccer team, about twice the variability (mean absolute deviation) on either team; on a dot plot, the separation between the two distributions of heights is noticeable. |
| Online Corse Hierarchy | 5.2 |
| I Can Statements | I can find similarities and differences in two data sets (including mean, median, etc.) |
| Standard | 7.SP.B.4 |
|---|---|
| Standard Description | 4. Use measures of center and variability for numerical data from random samples to draw informal comparative inferences about two populations. For example, decide whether the words in a chapter of a seventh-grade science book are generally longer than the words in a chapter of a fourth-grade science book. |
| Online Corse Hierarchy | 5.2 |
| I Can Statements | I can compare and conclude two populations based on their means, medians, and ranges. |
| Standard | 7.SP.C.5 |
|---|---|
| Standard Description | 5. Understand that the probability of a chance event is a number between 0 and 1 that expresses the likelihood of the event occurring. Larger numbers indicate a greater likelihood. A probability near 0 indicates an unlikely event, a probability around 1/2 indicates an event that is neither unlikely nor likely, and a probability near 1 indicates a likely event. |
| Online Corse Hierarchy | 5.3 |
| I Can Statements | I can recognize and explain that the probability of a chance event is a number between 0 and 1 that expresses how likely an event is to occur. |
| Standard | 7.SP.C.6 |
|---|---|
| Standard Description | 6. Approximate the probability of a chance event by collecting data on the chance process that produces it and observing its long-run relative frequency, and predict the approximate relative frequency given the probability. For example, when rolling a number cube 600 times, predict that a 3 or 6 would be rolled roughly 200 times, but probably not exactly 200 times. |
| Online Corse Hierarchy | 5.3 |
| I Can Statements |
I can collect data to approximate probability. I can use probability to predict the number of times an event will occur |
| Standard | 7.SP.C.7 |
|---|---|
| Standard Description | 7. Develop a probability model and use it to find probabilities of events. Compare probabilities from a model to observed frequencies; if the agreement is not good, explain possible sources of the discrepancy. a. Develop a uniform probability model by assigning equal probability to all outcomes, and use the model to determine probabilities of events. For example, if a student is selected at random from a class, find the probability that Jane will be selected and the probability that a girl will be selected. b. Develop a probability model (which may not be uniform) by observing frequencies c. in data generated from a chance process. For example, find the approximate probability that a spinning penny will land heads up or that a tossed paper cup will land open-end down. Do the outcomes for the spinning penny appear to be equally likely based on the observed frequencies? |
| Online Corse Hierarchy | 5.3 |
| I Can Statements |
I can investigate, develop and use probabilities to help me solve problems. I can compare probabilities to observed frequencies. I can develop a uniform probability model and use it to determine the probability of an event occurring. I can develop a probability model by observing frequencies in data developed from a chance process. |
| Standard | 7.SP.C.8 |
|---|---|
| Standard Description | 8. Find probabilities of compound events using organized lists, tables, tree diagrams, and simulation. a. Understand that, just as with simple events, the probability of a compound event is the fraction of outcomes in the sample space for which the compound event occurs. b. Represent sample spaces for compound events using methods such as organized lists, tables, and tree diagrams. For an event described in everyday language (e.g., "rolling double sixes"), identify the outcomes in the sample space which compose the event. c. Design and use a simulation to generate frequencies for compound events. d. For example, use random digits as a simulation tool to approximate the answer to the question: If 40% of donors have type A blood, what is the probability that it will take at least four donors to find one with type A blood? |
| Online Corse Hierarchy | 5.4 |
| I Can Statements | I can find probabilities of multiple events using organized lists, tables, tree diagrams, and simulations. I can use the sample space to compare the number of favorable outcomes to the total number of outcomes and determine the probability of the compound event. I can explain the outcomes in the sample space that make up an event. I can design and use simulation to predict the probability of a compound event. |
Features
| The ELC platform integrates well-known children's learning pedagogies with standardaligned courses for grades 1 to 12. It features an easy-to-use workflow for learning, practicing, and assessing student performance | ||||||||||||||||||||||||||||||||||||||||||||||||||||||||||||||||||||||||||||||||||||||||||||||||||
| Student features for Learning and Parent features for Monitoring and Support | ||||||||||||||||||||||||||||||||||||||||||||||||||||||||||||||||||||||||||||||||||||||||||||||||||
|
||||||||||||||||||||||||||||||||||||||||||||||||||||||||||||||||||||||||||||||||||||||||||||||||||


E-Workbook
Grade 7
 Number of Pages: 227
 Printable Version
Inside the e-Workbook
| CHAPTER 1:
The Number System — 7.NS |
Addition and Subtraction with Integers
Addition and Subtraction with Decimal Numbers Adding and Subtracting Fractions Multiplying and Dividing Integers Multiplying and Dividing Decimals Multiplying and Dividing Fractions Rational Numbers as Decimals |
| CHAPTER 2:
Ratio and Proportional Relationships — 7.RP |
Ratios and Unit Rates
Proportional Relationships Percent Applications Sale and Purchase Applications and Simple Interest |
| CHAPTER 3:
Expressions and Equations — 7.EE |
Manipulating Linear Expressions and Equivalent Expressions
Solving Linear Equations and Problem Solving Solving Linear Inequalities |
| CHAPTER 4:
Geometry— 7.G |
Scale Drawings
Constructing Triangles and Quadrilaterals Circumference and Area of Circles Angle Relationships Area of Triangle, Parallelogram and Trapezium Surface Area and Volume Circumference and Area of Circles |
| CHAPTER 5:
Statistics — 7.SP |
Populations and Samples and Estimating Populations
Measures of Central Tendency and Variation Understanding Probability Theoretical, Experimental and Compound Probability |
Common Core Standards


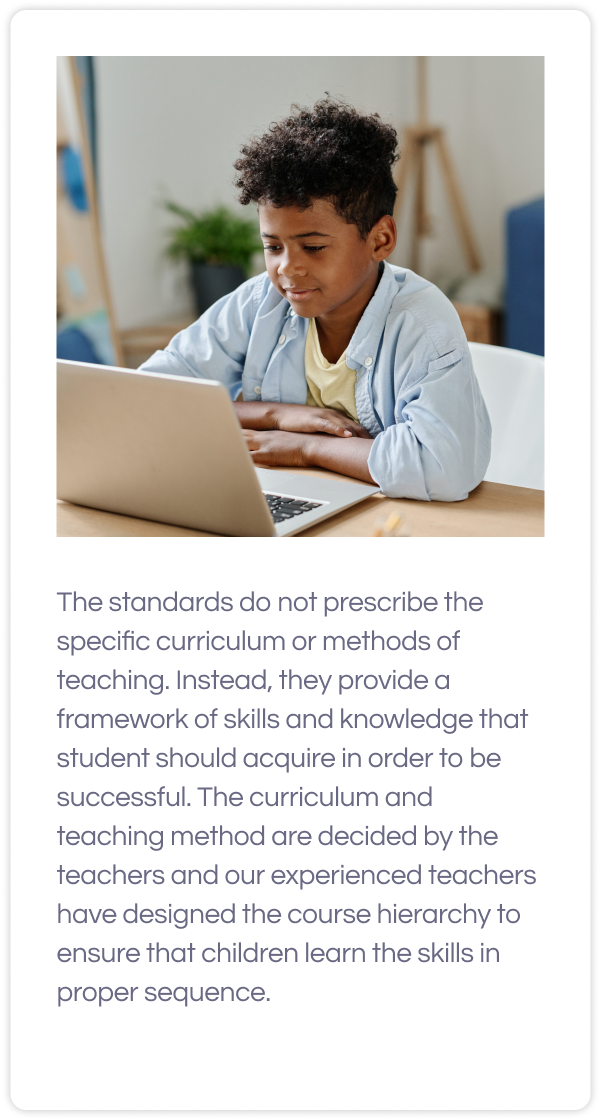
ELC courses cover 100% of skills defined in Common Core Math Standards for 7th grade. In addition to CCSS skills, our 7th grade course covers essential pre-requisites skills from previous grades for review and more advanced skills for students who want to get ahead.

How to read the grade level standards?
Grade 7 Math Domains Summary:
| Domains | Code | Topics |
|---|---|---|
| Ratio and Proportional Relationships | RP |
|
| Number System | NS |
|
| Expressions & Equations | EE |
|
| Geometry | G |
|
| Statistics & Probability | SP |
|
The following table summarizes what Math domains are covered in K-12 grades:
| Domains | Code | Grades |
|---|---|---|
| Counting & Cardinality | CC | K |
| Operations & Algebraic Thinking | OA | K,1,2,3,4,5 |
| Number & Operations in Base 10 | NBT | K,1,2,3,4,5 |
| NUMBER & Operations - Fractions | NF | K,1,2,3,4,5 |
| Measurement & Data | MD | K,1,2,3,4,5 |
| Geometry | G | K,1,2,3,4,5,6,7,8 |
| Ratio & Proportional Relationships | RP | 6,7 |
| Number System | NS | 6,7,8 |
| Expressions & Equations | EE | 6.7.8 |
| Functions | F | 8 |
| Statistics & Probability | SP | 6-7-8, |
| Number & Quantity | HSN | 9-12 |
| Algebra | HAS | 9-12 |
| Functions | HSF | 9-12 |
| Modeling | HSM | 9-12 |
| Geometry | HSG | 9-12 |
| Statistics & Probability | HSS | 9-12 |
Click here to discover the comprehensive Common Core State Standards.